Writing Slow Code (On Purpose)
[September 15, 2024]
Every few years, my research group holds a “slow code challenge.” The objective is to write the code with the lowest achieved instructions per cycle (IPC) when run on a pre-selected x86 server.
This seems absurd! And fundamentally, it is. However, there is some method to this madness. CPU designers work hard to achieve the highest possible IPC… even for very inefficient code. It is (intentionally) not easy to write very high IPC code. Therefore, the slow code challenge is a tricky exercise that forces you to think about how CPUs work and how to exploit their sharp edges.
The rules of our challenge are somewhat vague (it’s more about presenting solutions that are within the “spirit of the challenge”), but I’ll try to formalize them. Valid entries should be:
- single threaded
- actively executing instructions (not descheduled by the OS or something)
- purely “on device.” They should not involve external devices (e.g. waiting on I/O)
In this post, I will discuss a couple different approaches to this challenge.
Additional note: all performance results come from an AMD EPYC 7763 64-Core Processor (Zen3).
Python Is Slow, Why Not Just Write Python?
This is a reasonable question! The key distinction here is between code being slow at achieving its intended result and code running slowly on the CPU. If I write the sieve of Erasthosthenes in Python, it will be very slow at actually sieving numbers, but the code (well, mostly the Python interpreter’s code) will execute at very high IPC. I benchmarked this, and consistently saw nearly 5 IPC on my machine. Importantly: Python is slow not because it has low IPC, but because it needs a huge amount of instructions to execute each line of code.
Approach 1: Pointer Chasing
“Linked lists are slow because of pointer chasing” is a commonly repeated nugget of wisdom. But, what exactly does it mean?
Consider the following code:
Node* root = make_circular_linked_list(...);
Node* cur = root;
while (true) {
    cur = cur->next;
}
Also represented in this diagram:
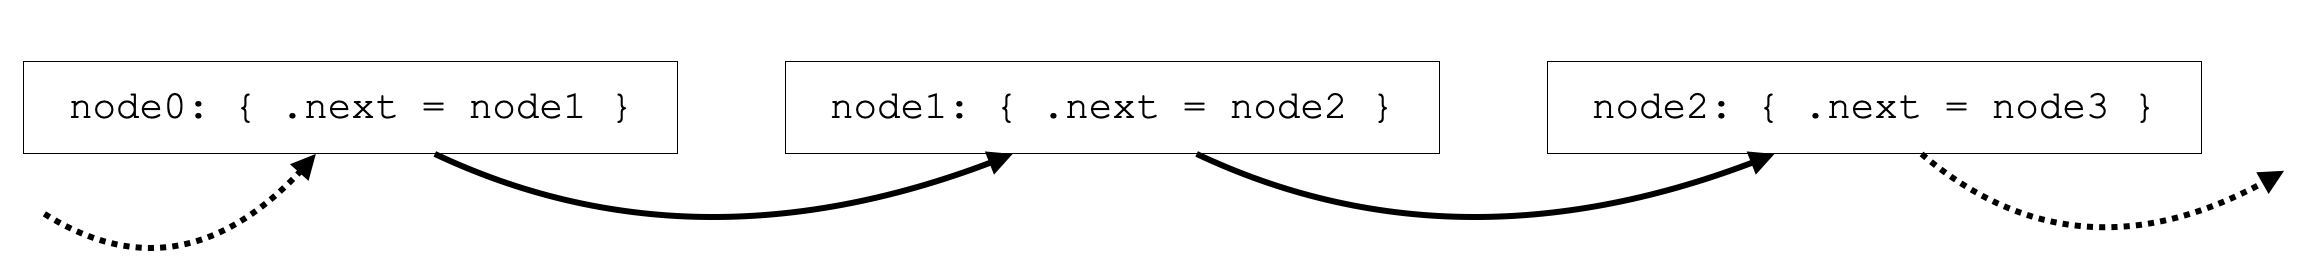
What makes this code slow is that it is very fundamentally sequential. If we are currently at node0, we do not know what address to load next until we are done loading node0. If loading node0 takes a long time because of a cache miss, then we are stuck twiddling our thumbs. Modern CPUs have a lot of hardware dedicated to exploiting instruction-level parallelism (ILP)… but it’s hard to exploit ILP if there is none!
So, the first slow code idea is to carefully construct a circular linked list with the following two properties:
- Huge, so it won’t fit in cache
- Nodes that are close to each other in the linked list live far from each other in memory. This ensures that our access pattern has no locality and all accesses will be cache misses. Then, we can traverse it forever with abysmal IPC.
I wrote code to construct such a linked list, used the code above to traverse it forever, then compiled my program with -O0 (to be extra slow). Here are the results I got back from perf stat:
    18.022591244      3,523,728,182      cycles:u
    18.022591244         52,440,970      instructions:u            #    0.01  insn per cycle
Not bad. 1/67 IPC is pretty slow. However, I think we can do a bit better. Specifically, we can do a bit better by compiling with -O3! Here are the results of executing the same infinite linked-list traversal, but this time compiled with -O3:
    16.018577682      3,520,128,798      cycles:u
    16.018577682         20,716,958      instructions:u            #    0.01  insn per cycle
1/170 IPC is much slower! Confusingly, -O3 is supposed to be faster than O0.
By looking at the assembly generated by the traversal loop in both cases, we can understand why this is happening. With -O0 we have the following assembly:
    1528:       48 8b 45 f0             mov    -0x10(%rbp),%rax
    152c:       48 8b 45 f0             mov    -0x10(%rbp),%rax
    1530:       48 8b 00                mov    (%rax),%rax
    1533:       48 89 45 f0             mov    %rax,-0x10(%rbp)
    1537:       eb ef                   jmp    1528 <main+0x2c>
whereas with -O3 we have:
    13e0:       48 8b 1b                mov    (%rbx),%rbx
    13e3:       eb fb                   jmp    13e0 <main+0x20>
In both cases, the loop body has a single painful, sequential, cache-missing memory access. However, in the -O0 case, the loop has 5 instructions and in the -O3 case it has just 2. Recall that the numerator of IPC is instructions. If our loop has 4 fast instructions and 1 slow instruction (the load to ->next), then the IPC will be much higher than a more optimized version of the same loop with just 2 instructions.
The lesson here is that to get low IPC, code must be highly optimized :)
Approach 2: A Linked List of Jumps
The previous approach focused primarily on generating data cache misses. Our code traversed a vast linked list, but the code itself was a tiny 2 instruction loop that easily fits in the instruction cache (iCache). Another way of achieving low IPC is making code that frequently misses in the iCache. We can achieve this by generating a huge, poor-locality linked list of jumps.
We can generate a small (demo) program like this directly in x86 assembly:
.global main
main:
    jmp l0
l0:
    jmp l2
l1:
    jmp l3
l2:
    jmp l4
l3:
    jmp l0
l4:
    jmp l1
If we execute this program, then it will jump around as follows: main -> l0 -> l2 -> l4 -> l1 -> l3 -> l0 -> ... and repeat forever. To write this assembly, I provide two inputs: a prime number P and a smaller number shift to a simple Python script:
with open(f"jmps_{P}_{shift}.s", "w") as f:
    f.write(".global main\n")
    f.write("main:\n")
    f.write("\tjmp l0\n")

for i in tqdm(range(P)):
    f.write(f"l{i}:\n")
    next_lbl = (i + shift) % P
    f.write(f"\tjmp l{next_lbl}\n")
Given that P is prime, I can pick any value of shift and the cycle will traverse all the labels before returning to l0. This is very important to maximize the iCache footprint. We also want to pick shift to be sufficiently large that subsequent labels are not only on different cache lines, but also on different pages in virtual memory.
For my experiments, I picked P = 67108859 and shift = 2346, though plenty of other numbers work fine. Running it, I get the following results:
     3.003449075      3,488,476,061      cycles:u
     3.003449075          8,124,252      instructions:u            #    0.00  insn per cycle
Not bad! That’s 1/429 IPC– significantly slower than the previous approach.
This is because this code has several “desirable” (well, for our purposes) properties beyond just missing in the iCache. Modern processors are built with a lot of machinery to predict a program’s next instruction. This machinery allows them to speculatively fetch, decode, and schedule instructions well ahead of time, and is absolutely necessary to fill their deep pipelines. With this 67108859 instruction jump cycle, we are absolutely overwhelming all of those predictors.
For example, the Zen3 processor I am using has a 1024 entry branch-target-buffer (BTB). This structure allows the processor to cache each jump’s “target”. 1024 entries is a huge BTB! However, it’s about 65,000 times too small to actually be helpful with our particular program. The constant BTB misses contribute heavily to our delightfully low IPC.
I think Approach 2 nicely showcases just how painful poor instruction locality can be.
Approach 3: Accounting Tricks
I like to think that approaches 1 and 2 showcase (and exploit) some fairly general computer architecture concepts. Approach 3 is an an x86-specific gag.
x86 has many instructions. Some of them can be prefixed with rep. rep repeats an instruction many times, decrementing the rcx register at every iteration (and also adding 1 to both rdi and rsi), only stopping when rcx is 0.
In fact, a common method of implementing memcpy is using rep movsb: a repeated mov byte instruction. On modern x86 machines, rep movsb is optimized (in hardware) to be extra efficient for large memcpys.
However: it is also a great way to get a “single instruction” to do a lot of work. In this example program, we set rcx to INT_MAX and just copy over the same data forever:
#define N ((1ul << 31) - 1)

char src[N];
char dst[N];

inline void memcpy_rep(char *dst, char *src, size_t n) {
    __asm__ volatile (
        "cld\n\t"
        "rep movsb\n\t" // <------------ the actual rep movsb instruction
        : "+S"(src), "+D"(dst), "+c"(n)
        :
        : "memory"
    );
}

int main() {
    while (1) {
        memcpy_rep(dst, src, N);
    }
}
So, for “accounting purposes”, this is a single instruction doing over 2 billion iterations. In practice, we won’t actually get an IPC of 1 / 2 billion. This is for 2 reasons:
1) As I mentioned, rep movsb is very efficient in hardware, so it will copy over the data in cache-line sized chunks, so really, it’ll do 2 billion / 64 ~ 33.6 million cycles of work.
2) Our loop body isn’t just rep movsb, it also needs a couple of bookkeeping instructions to reset rdi, rsi, and rcx to their initial values, clear the direction flag (this isn’t relevant beyond saying that you have to do it, and it costs us 1 instruction per loop iteration), then jump back to the start. So, really, we’re doing 6 instructions every loop iteration, giving us an expected IPC of 33.6 million / 6 = ~ 5.6 million.
Running the program, we can observe that this isn’t too far from the steady-state truth:
    25.027657535      3,523,022,380      cycles:u
    25.027657535                598      instructions:u            #    0.00  insn per cycle
An IPC of 1 / 5.9 million!
I do think that this approach is basically cheating. It’s just an accounting trick. If the processor’s performance counters counted each iteration of rep movsb as an instruction (which in my opinion would be more natural), then this code would achieve quite a high IPC. So, I think this is very different from the other solutions. It’s fun to play with, but it’s fun more in a “haha x86” kind of way than in a fundamental computer architecture kind of way.
Conclusion
In this post, I showcased 3 different tricks for writing extremely slow code. I have a couple more stashed away, and when I have time, I’ll write about those too. However, I’m also always on the hunt for more! If you know any neat ways to achieve absurdly low IPC (on any architecture!), please tell me about them :)